Blog
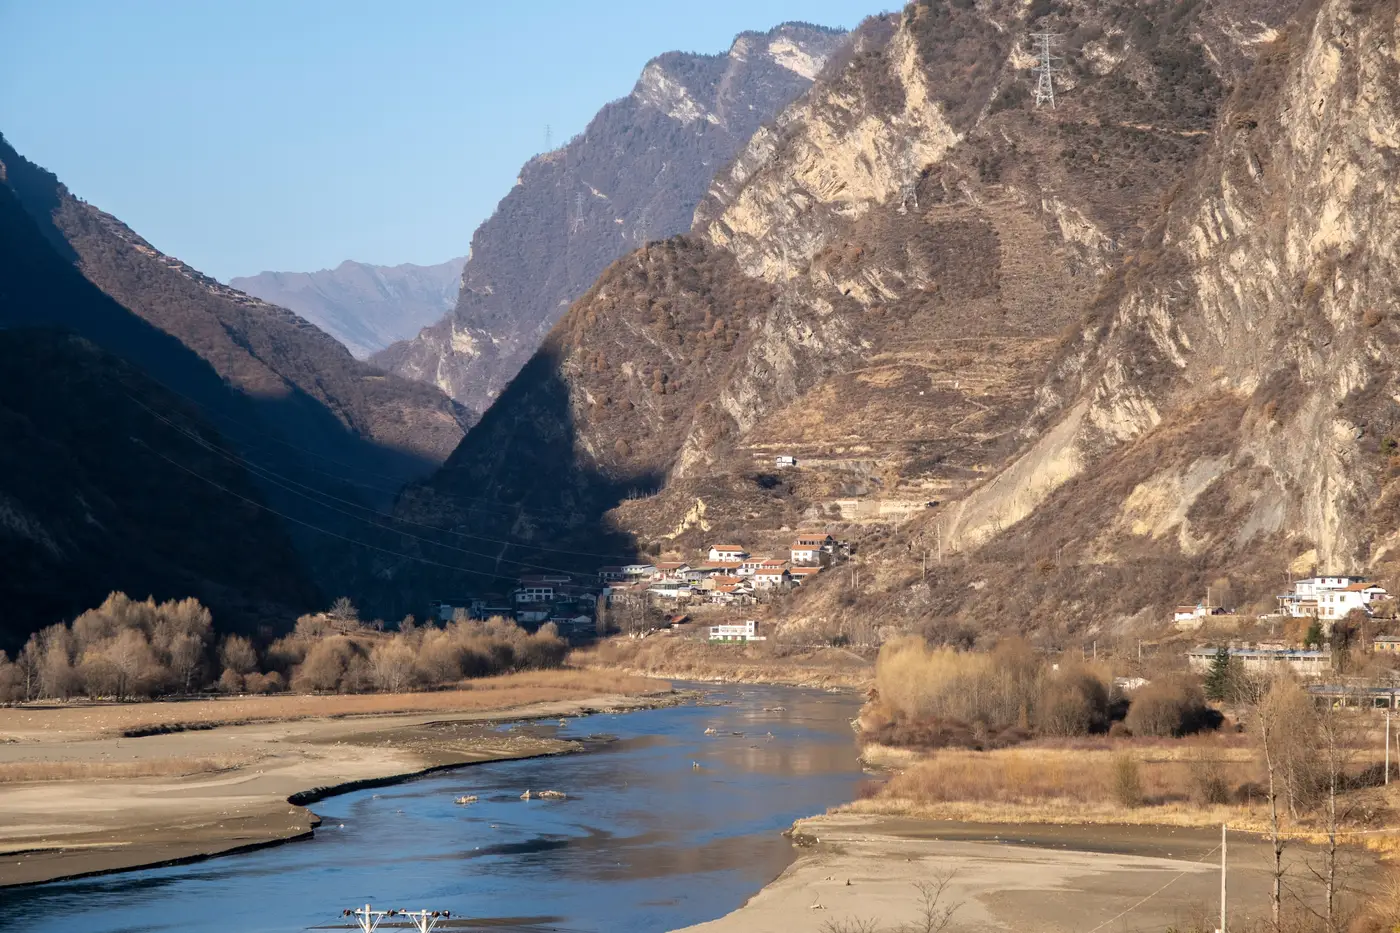 Field notes: the valley that lit up two years before the completion report said it would
A portfolio economist's notes on a grid-extension project where the lights came on years ahead of the paperwork that was supposed to confirm it.
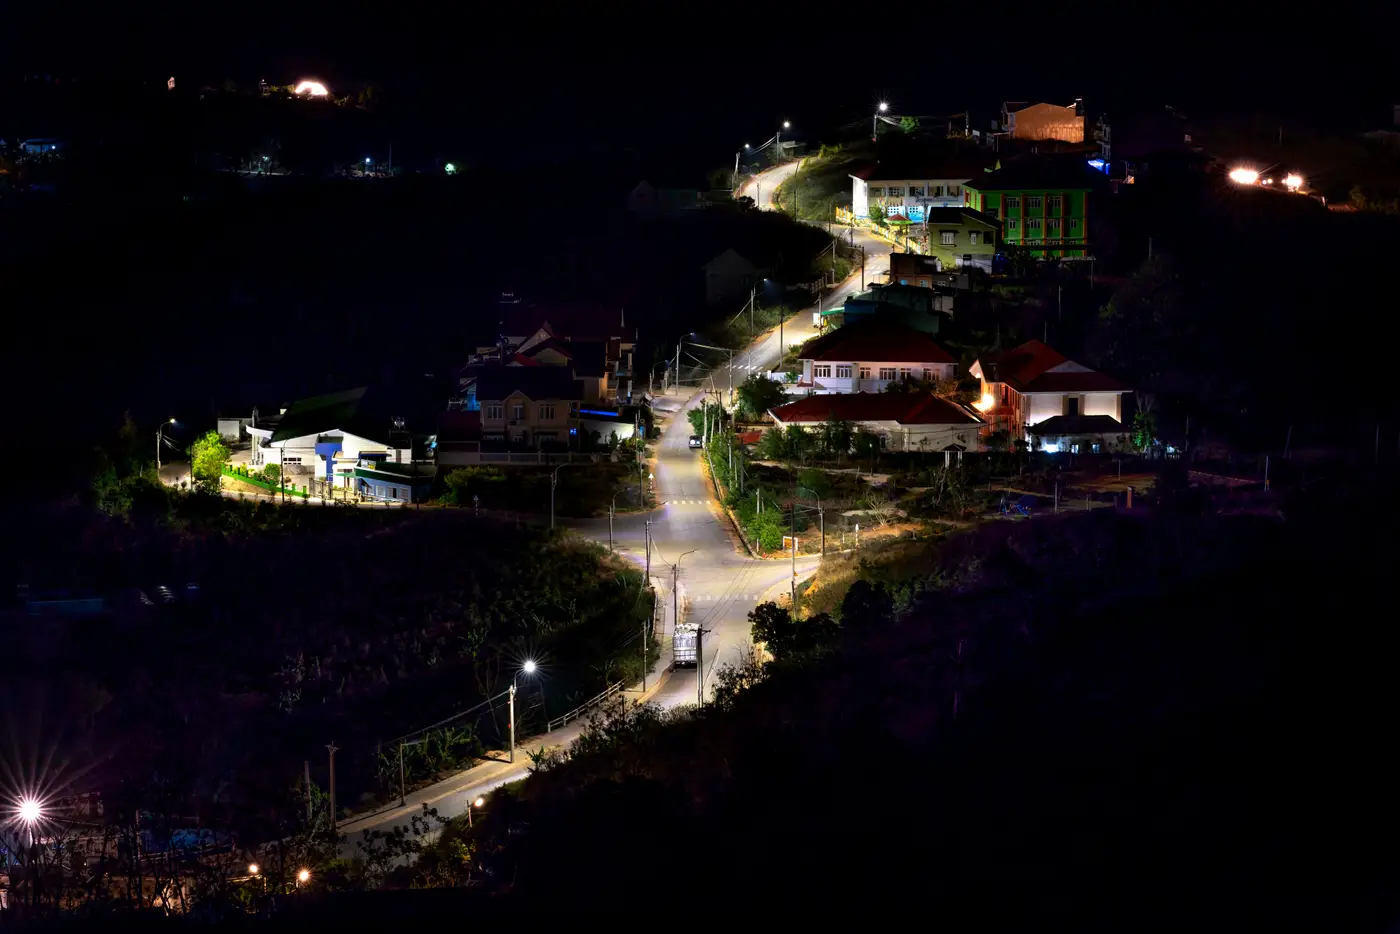 How often should night-light imagery refresh between project supervision missions?
How monthly night-light cadence fills the gap between electrification project supervision missions.
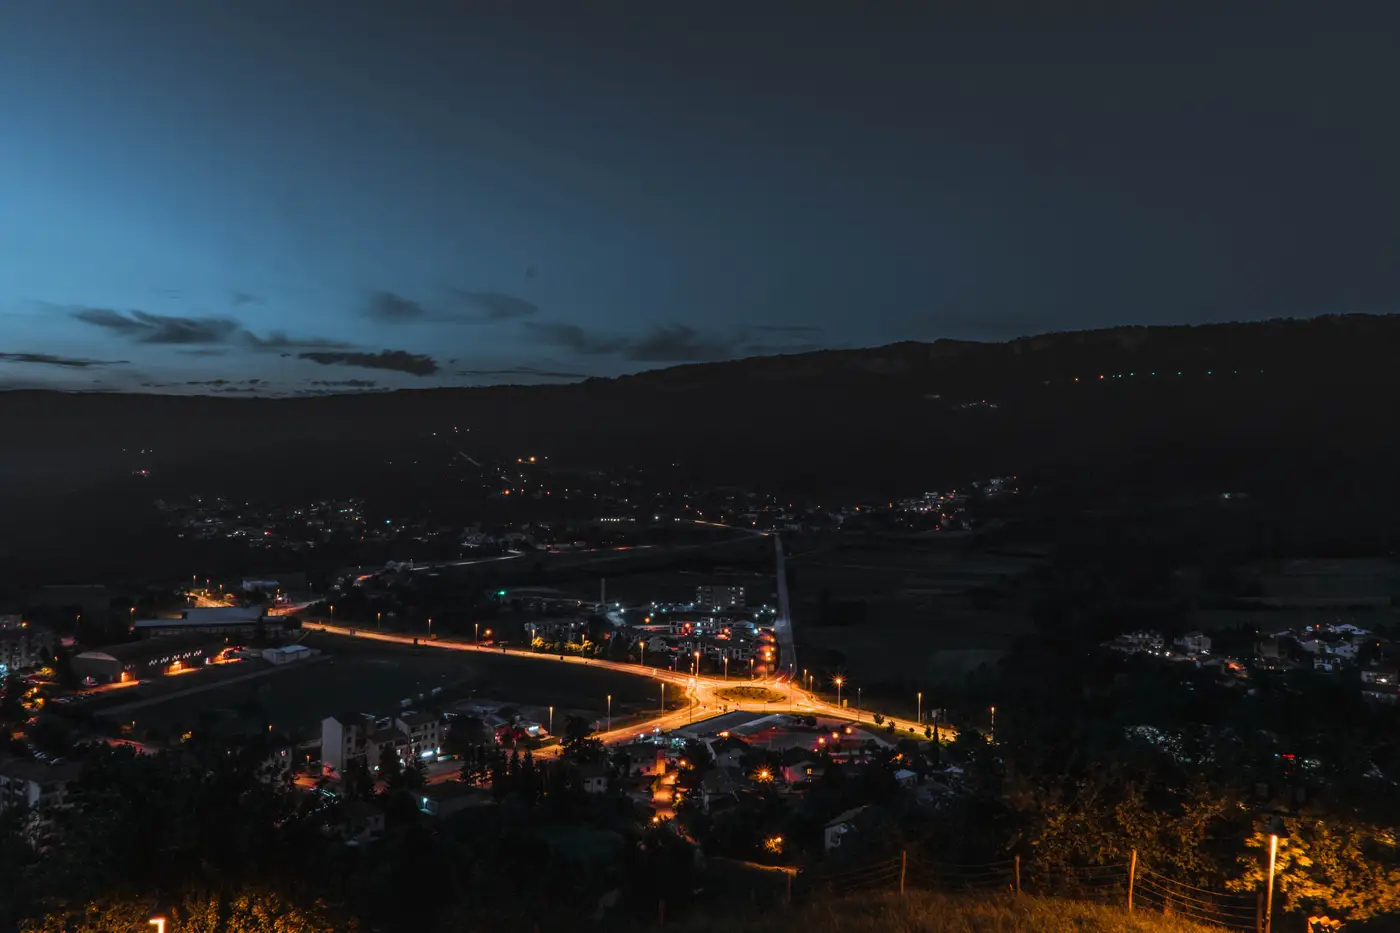 Attributing a night-light increase to your project, not the one next door
How to tell whether a night-light increase at your project's edge is your rollout or spillover from a neighbouring electrification programme.
- What is blooming in night-light satellite data?
Why night-light satellite imagery makes a settlement look bigger than its grid reach, and what that means for tracking financed electrification projects.
- Field notes: three country teams, one chart request, three different answers
A quarter-end comparability problem: three country teams asked for the same night-light chart and got three answers. What was actually different.
 How to read a night-light trend chart in a supervision mission aide-memoire
What the monthly light-intensity line in your aide-memoire annex shows, where it corroborates PDO indicators, and where it doesn't.
 How to flag a stalled electrification tranche before the midterm review
Independent signals for spotting a stalled electrification tranche before it surfaces at the midterm review.
 Grid connection vs. grid-ready: what a loan covenant requires
How rural electrification covenants define grid connection versus grid-ready, and why that gap matters for disbursement decisions.
- Field notes: the valley that went dark for three dry-season months
A grid-extension valley dimmed for three dry-season months and the portfolio team didn't flag it. Here's how to tell seasonal dip from real setback.
- How to tell grid densification from new grid extension in a monthly light read
A night-light pixel getting brighter can mean a new line arrived or existing customers just took up more connections. Here's how to tell which.
 Mini-grid or national grid: reading light signatures on a night-light map
How to tell a mini-grid energisation from national grid arrival on a monthly night-light read, by shape and spread, not just brightness.
- What is an energy access tier, and how does night-light data relate to it?
A plain explainer on the Multi-Tier Framework's energy access tiers and what satellite night-light intensity can and can't tell you between surveys.
- Monitoring a power sector loan between ICRs
What to track on a disbursed power sector loan in the years before the ICR, and where official reporting leaves a gap.
- Panchromatic vs. multispectral imagery for tracking electrification progress
A single panchromatic band is the right tool for tracking grid-extension progress between field surveys.
- How to verify grid extension progress between official censuses
Census and DHS rounds run years apart. Here's what a portfolio team can check in between to confirm grid extension is actually happening.
- Nighttime lights as a GDP proxy: how reliable is it for project appraisal?
How reliable is nighttime-light luminosity as a GDP growth proxy for project appraisal, and where the method holds up.
- VIIRS nighttime lights vs. DHS survey data for rural electrification monitoring
How VIIRS night-light data and DHS household surveys differ for tracking rural electrification, and where each one helps a portfolio team.
- What is a disbursement-linked indicator for electrification projects?
A plain explanation of DLIs in electrification financing, what triggers a tranche release, and why the verification gap matters for portfolio tracking.