Field notes: the valley that went dark for three dry-season months
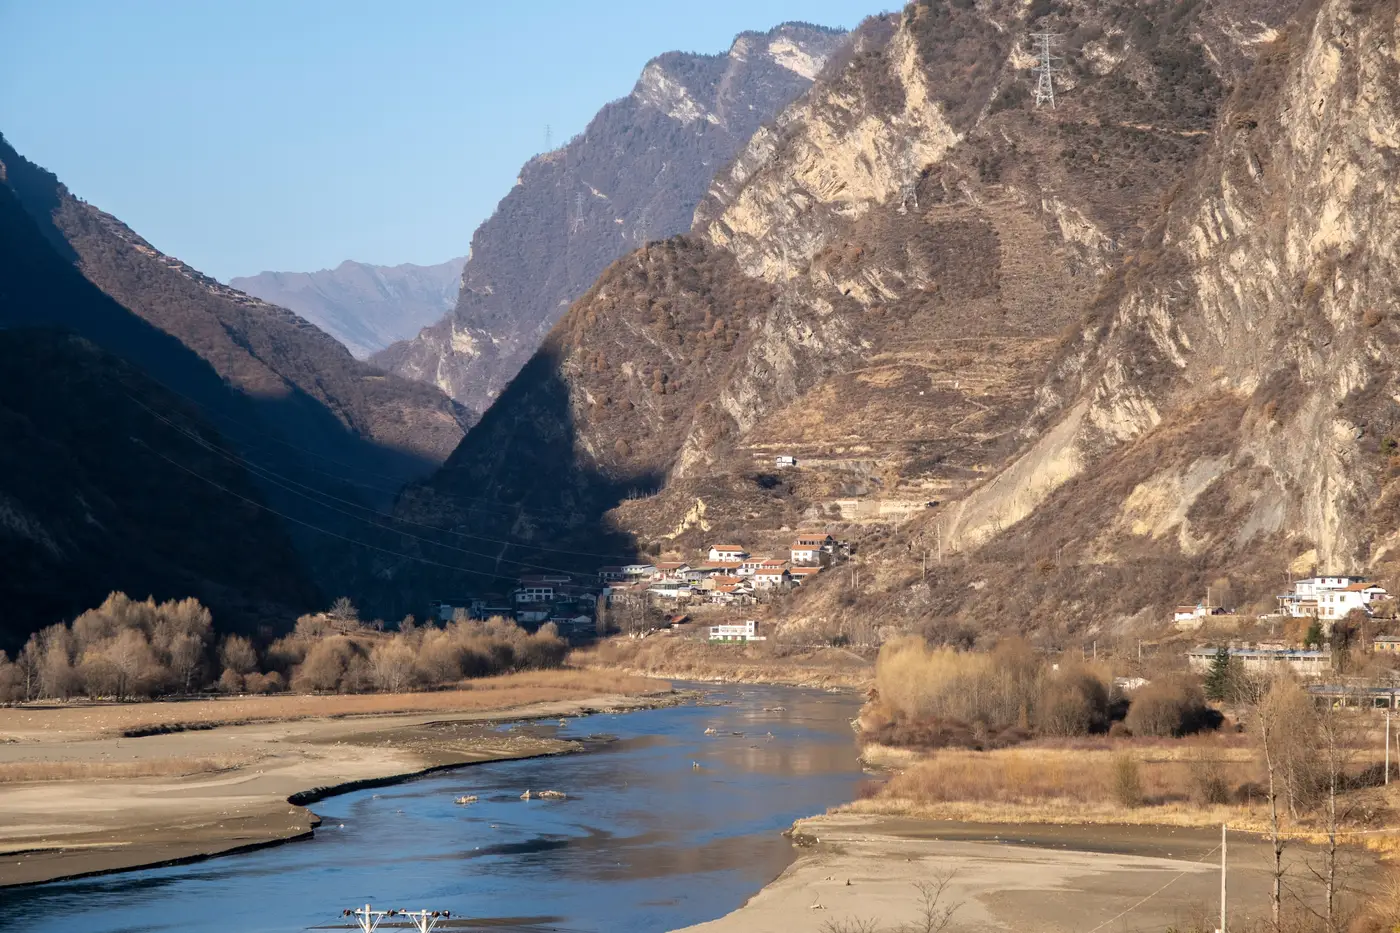
A hydropower-fed grid extension we've watched this year gave its implementation team a scare in April. Three townships along a river valley, all wired up the season before, dropped in average night-light intensity for three straight months. The decline was steady, month over month, the kind of curve that makes a portfolio economist reach for the phone.
Nobody called it a setback, though. They checked the rainfall record first.
The scheme is run-of-river. No reservoir to speak of, so output tracks flow almost directly. Dry season arrives, the river drops, the plant derates, and every settlement downstream of it dims a little whether its connections are working perfectly or not. The valley's drop in brightness tracked the river's flow; the grid underneath was holding steady.
This is the kind of thing that never shows up in a results framework until someone has already drafted a memo about underperformance. Connection counts, kilometers of line strung, transformers commissioned: those are fine indicators for what got built. They say nothing about whether the lights stay on through March. A night-light series does, and it does it monthly instead of at the next field mission, which on this programme was eleven months out.
The team worked from two separate readings. Average intensity across the three townships fell, roughly in step with the river gauge upstream. The count of lit pixels, the actual footprint of where electrification has reached, held steady. Nothing that had been lit went dark; fewer settlements simply stayed bright enough to register at full strength. That split matters more than either number alone: a programme that's genuinely stalling tends to show both measures sliding together, footprint included, because connections that were never finished don't come back when the rains do. This one came back in June, on schedule, when flow recovered.
It's worth saying plainly that a coarse monthly read like this won't tell you why a single sub-station tripped or which feeder has a bad transformer. It won't give you a connection rate, or confirm a disbursement condition on its own. What it gives you is a shape over time for a place you can otherwise only see once a year, and a shape that matches a known seasonal pattern is a very different finding from one that doesn't. The dry-season dip is now a known pattern for this basin. Next April, the loan officer won't open a case file. They'll check the river gauge, same as this year, and move on.
The harder version of this problem is the valley where the dip doesn't recover. Flow comes back in June and the lights stay dim, or recovery lags by two months with no hydrological reason for it. That's the signal a results framework actually wants, and it only shows up against a baseline of what normal seasonal variation looks like for that specific terrain. You can't build that baseline from one survey. You need the monthly thread running under it, for this valley and the next one, so a genuine stall stands out against something other than guesswork.
That's the quieter use of a product like this, honestly. Less about catching problems in real time, more about not inventing problems that aren't there. A monthly night-light read over a programme area earns its keep on the months nothing is wrong just as much as the months something is.
If your portfolio has a valley like this one, dry season is a good time to start watching it.