How often should night-light imagery refresh between project supervision missions?
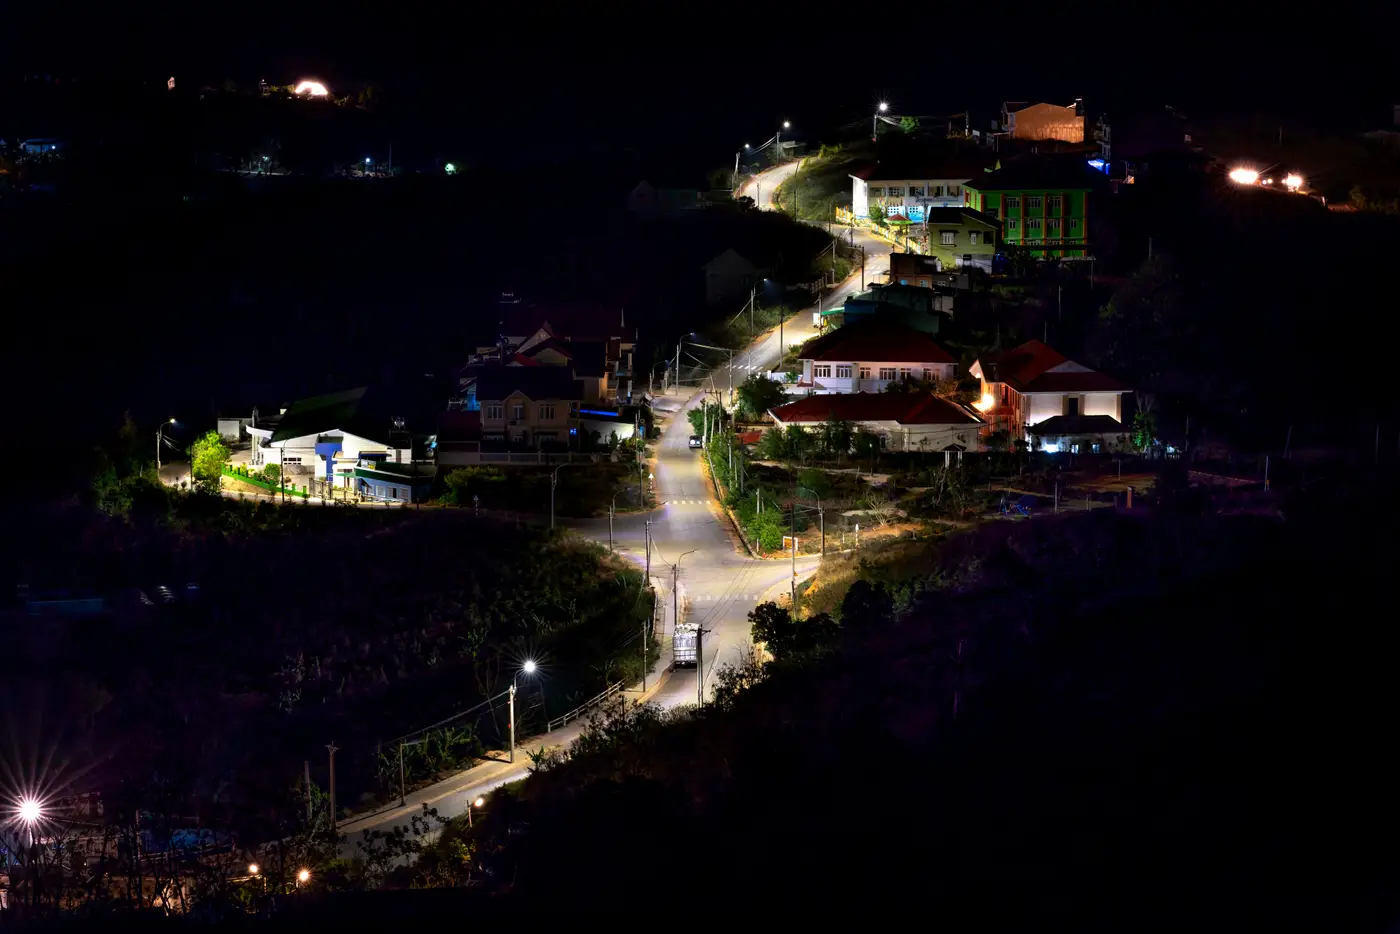
Supervision missions for an electrification project run on a fixed clock, often every six months, sometimes annually once a project is late-stage or the country office is stretched thin. Between missions, the project implementation unit files progress reports, but those reports describe what the contractor says it did, not what's visible on the ground. For a portfolio economist trying to flag a stalled lot before the next field trip, the gap between missions is the real exposure.
Night-light imagery closes part of that gap, if the refresh rate matches the thing you're trying to catch.
What a monthly cadence actually catches
Grid extension in a rural electrification programme moves in small increments spread over weeks: a transformer energized here, a few kilometers of line commissioned there. Monthly night-light reads capture that kind of change because the comparison unit stays the same, this month against last month, same settlements, same reference bands. A quarterly read averages over three months of construction and connection activity, which flattens exactly the signal a supervision economist wants, the pace of rollout against the contractor's own schedule.
Annual satellite passes, the kind many open data archives default to, will tell you a programme area got brighter over a year. They won't tell you whether that happened in month two or month eleven, and that distinction matters when a disbursement condition is tied to an installation milestone.
Monthly turns out to be the coarsest cadence that still lines up with how electrification projects progress, lot by lot, with enough resolution to notice a lot that's gone quiet for two consecutive reads.
Matching imagery cadence to your mission calendar
A six-month supervision cycle with monthly night-light reads gives a portfolio team five or six data points between each field visit, enough to see a trend, not just a before-and-after snapshot. That's the difference between writing "activity has picked up since March" and writing "activity picked up, flattened in July, and is flat again now," which is a far more useful line in a back-to-office report when the contractor is still claiming the lot is on schedule.
If your mission calendar runs annual rather than semi-annual, the case for monthly imagery holds even more weight. A full year between field visits leaves plenty of room for a lagging lot to go unnoticed, and the official electrification-rate statistics from a household survey or census won't fill that gap. Those surveys run on their own multi-year cycle and rarely disaggregate below district level, which isn't the resolution a project team needs for a specific set of settlements under one loan.
Weekly or daily revisit, the kind some satellite platforms market for other use cases, doesn't add much here. Night-light signal from grid extension doesn't shift week to week in ways that change a supervision file. A higher cadence mostly adds noise from cloud cover and seasonal lighting differences without changing the answer the portfolio team needs.
Where this fits next to a field mission
A monthly night-light read doesn't replace the supervision mission. The field team still verifies meter installations, checks transformer nameplates, and talks to the utility's district office. What the monthly read does is tell that team where to point its field days: which lots look stalled on the imagery and deserve a site visit, and which ones can be confirmed from the desk because the light has been spreading steadily since the last report.
Electrification Map builds that monthly read around the settlements in a programme area, so a portfolio team has a trend line to check against the implementation report before the next mission is even on the calendar.
If you're mapping a supervision cycle against a financed electrification programme, start with the monthly read for your project area.